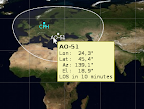
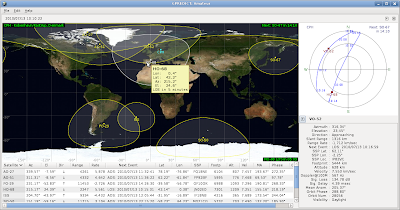
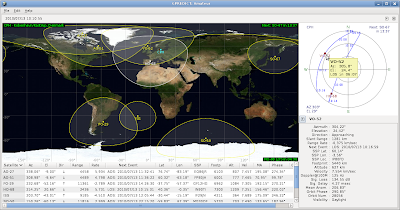
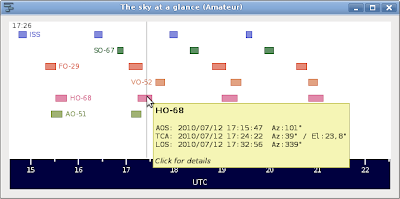
 You may have already seen tooltips in the Gpredict user interface. I have made extensive use of them for providing short description of the functionality of the GUI controls all over the application. Lately, I have felt a desire to extend the usage of tooltips to also include graphical objects like satellites shown on the map or the passes shown in the “Sky at a glance” module.
Gpredict uses GooCanvas for graphics, which adds a the “missing” 2D canvas library to Gtk+. Since version 0.15 GooCanvas includes support for Gtk+-like tooltips for any objects on the canvas. This is really great since it simplifies the effort from messing with own popup windows to using single line API calls.
Watch the video on Youtube.
When you move the mouse over a satellite in the map view, the tooltip will show the Latitude, Longitude, Azimuth, elevation and the time to AOS or LOS for the satellite.
In the polar view it will only show Azimuth, Elevation and time to LOS.
I have also added tooltip to the “Sky at a Glance” object. when the user moves the mouse over a pass the tooltip will show a summary of the pass.
Behind the scenes
Adding the tooltips was a two step process. First, it has to be enabled for the canvas:
g_object_set (G_OBJECT (canvas), "has-tooltip", TRUE, NULL);
then, for each object the tooltip can be set as a usual G_OBJECT property:
  item = goo_canvas_rect_model_new (root, 10, 10, 20, 20,
                                    "stroke-color-rgba", bcol,
                                    "fill-color-rgba", fcol,
                                    "tooltip", "Hello, I am a cool tooltip",
                                    NULL);
It is really as easy as it should be!
During runtime, the tooltip text can be updated by using a g_object_set() call. Unfortunately, the tooltip contents on the screen are not updated if the tooltip is already shown when the next text is set. But if the mouse is moved a few pixels the tooltip is updated. A small quirk that I’ll have to look into.


