After fixing several major and minor bugs in Gpredict 1.1 it was time to look at what new cool features version 1.2 should include. Fortunately, there is a nice list of feature requests from users that have been accumulated over time so all I had to do was to pick one and start working on it. This time I picked improvement of the layout engine.
New Layout Engine
I think we can agree that Gpredict is already one of the most flexible satellite tracking application applications when it comes to customising how the tracking data is presented to the user. In version 1.1 the user can chose between four different visualisation modules that can be arranged in many different layouts. Despite this flexibility, the available options are still limited to a fixed number of possibilities that is more or less hard coded into the software. I wanted to change this into something more generic that does not put any hard limits on what is possible.
I decided that the best and easiest way to accomplish this – also considering the limitations of the underlying Gtk+ toolkit – was to allow the user to place any number of views in a virtual grid. This means that when the user selects a given view to include in the module he/she has to specify the grid-coordinates for the module. The size of the grid will then be automatically determined according to the specified coordinates for all modules.
As of writing, the only way to create these fancy layouts is to specify it manually using an array of integers. The array has 5 numbers for each view:
- The first number is the view type
- 0: List view (table)
- 1: Map view
- 2: Polar view
- 3: Single satellite view
- 4: Event list view (to be implemented)
- The second number is the left-attach coordinate of the view starting from 0
- The third number is the right-attach coordinate of the view
- The fourth number is the top-attach coordinate of the view starting from 0
- The third number is the bottom-attach coordinate of the view
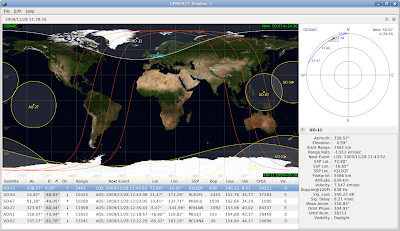
The coordinate system of the grid has origin (0,0) in the top left corner. So, the layout code for the module shown above is:
1;0;3;0;3;0;0;3;3;4;2;3;4;0;2;3;3;4;2;4
Creating layouts this way is really fun for me, though I fear it would scare the hell out of regular users — in particular those who are just trying Ubuntu Linux for the first time. Obviously, a better configurator GUI is needed. To begin with, Gpredict 1.2 will include a set of pre-configured layouts and still allow to enter the layout code manually for custom configurations. The user manual will describe the layout configuration in detail. I hope then that somebody will create a fancy drag-and-drop layout configurator for a later release.
If you know me you have by now figured out that the primary reason for this new feature was my desire to be able to make cool video recordings of satellite passes such as this one (yes, that’s Gpredict 1.2 in action).
Event List View
Now that Gpredict allows creating complex layouts, the next problem is the lack of views. Currently, there are only four different kind of view (shown on the screnshot above) and few more would be really nice to have. Ideas that have been tossed around over the years include:
- Sky view – showing a photographic view of the sky
- Space view – a camera following (or attached to) the satellite showing the Earth from space
- Event list view – showing a list of upcoming events and counting down to the event.
For version 1.2, I expect to implement the last one – Event list view – simply because it is relatively easy. It will show the satellites tracked in the module with a count down clock to their next AOS (or LOS if they are within range). Alternatively, the user will be able to select showing the time of AOS/LOS instead of the count down. The list will be sortable according to either satellite name or time.
I hope you are as excited about the next release as I am. Feel free to leave any thoughts or comments you might have!